Yarn Evenness (Uster) Guide for Knitted Scarves & Beanies

Yarn Evenness (Uster) Guide for Knitted Scarves & Beanies
Uneven yarn creates uneven fabric. Thick spots become visible bumps. Thin spots become weak points that may break during knitting or wear. Yarn evenness — measured by Uster statistics — is the foundation of consistent knitted fabric quality.
This guide covers Uster evenness testing for yarns used in knitted scarves and beanies. You'll learn about CVm, thick places, thin places, neps, and how to interpret Uster test reports for quality assurance.
1. What is Yarn Evenness?
Yarn evenness refers to the uniformity of yarn thickness along its length. Even the best yarns have natural variation — fibers are not perfectly uniform. The question is how much variation is acceptable.
Poor yarn evenness causes:
- Visible fabric defects: Thick/thin stripes, uneven dye uptake, surface bumps
- Weak fabric areas: Thin spots reduce tensile strength
- Knitting problems: Yarn breaks, needle damage, machine stops
- Inconsistent hand feel: Some areas feel softer or firmer
2. The Uster System
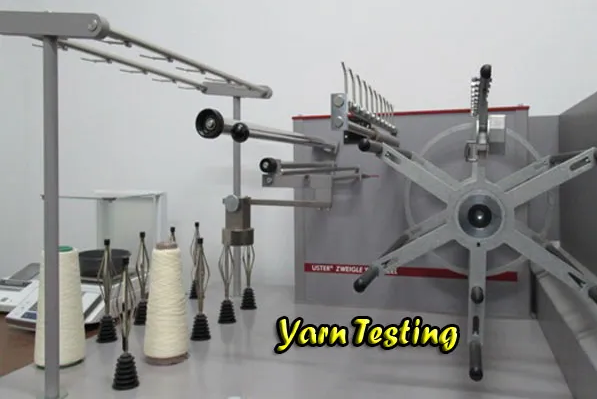
Uster Technologies is the global standard for yarn testing. The Uster Evenness Tester measures yarn thickness variation using capacitive sensors. Results are compared to Uster Statistics — a global database of yarn quality benchmarks.
Key Uster Measurements
| Measurement | Symbol | What It Measures | Unit |
|---|---|---|---|
| Coefficient of Variation of mass | CVm | Overall mass variation along the yarn | % |
| Thin places | -50% | Number of places where yarn is 50% thinner than average | per 1000m |
| Thick places | +50% | Number of places where yarn is 50% thicker than average | per 1000m |
| Neps | +200% | Number of small fiber tangles (knots) thicker than +200% | per 1000m |
3. Understanding Uster Statistics
Uster Statistics are percentiles. The lower the percentile, the better the yarn quality.
| Percentile | Quality Level | Interpretation |
|---|---|---|
| 5% | Excellent | Top 5% of global yarn production — premium quality |
| 25% | Good | Above average — suitable for most commercial applications |
| 50% | Average | Median quality — acceptable for basic products |
| 75% | Poor | Below average — visible defects likely |
| 95% | Very Poor | Bottom 5% — unacceptable for quality knitwear |
5% (Excellent) > 25% (Good) > 50% (Average) > 75% (Poor) > 95% (Very Poor)
4. Acceptable Uster Levels for Knitted Scarves & Beanies
4.1 By Yarn Type
Cotton Yarn (Carded, Ne 20-30)
| Parameter | Acceptable (50% tile) | Good (25% tile) | Premium (5% tile) |
|---|---|---|---|
| CVm (%) | ≤18% | ≤16% | ≤14% |
| Thin places (-50%) | ≤30 | ≤15 | ≤5 |
| Thick places (+50%) | ≤200 | ≤100 | ≤50 |
| Neps (+200%) | ≤250 | ≤150 | ≤80 |
Wool / Wool-Blend Yarn (Nm 24-32)
| Parameter | Acceptable (50% tile) | Good (25% tile) | Premium (5% tile) |
|---|---|---|---|
| CVm (%) | ≤16% | ≤14% | ≤12% |
| Thin places (-50%) | ≤20 | ≤10 | ≤3 |
| Thick places (+50%) | ≤150 | ≤80 | ≤40 |
| Neps (+200%) | ≤200 | ≤120 | ≤60 |
Acrylic Yarn (Nm 20-28)
| Parameter | Acceptable (50% tile) | Good (25% tile) | Premium (5% tile) |
|---|---|---|---|
| CVm (%) | ≤14% | ≤12% | ≤10% |
| Thin places (-50%) | ≤15 | ≤8 | ≤2 |
| Thick places (+50%) | ≤100 | ≤60 | ≤30 |
| Neps (+200%) | ≤120 | ≤80 | ≤40 |
5. What Causes Uneven Yarn?
- Raw fiber quality: Short fibers, variable fiber length, contamination
- Carding and combing: Poor fiber alignment creates slubs and neps
- Drafting system issues: Roller eccentricity, improper roller pressure, worn aprons
- Roving quality: Uneven roving feed causes mass variation
- Spinning process: Ring frame, rotor, or air-jet settings affect evenness
- Yarn count variation: Inconsistent linear density
6. How Yarn Evenness Affects Knitted Fabric
| Yarn Issue | Effect on Scarf/Beanie | Visibility |
|---|---|---|
| High CVm (overall variation) | General uneven appearance, stripe effects | Visible from 0.5-1m |
| Thin places | Weak spots, potential holes during knitting or use | Visible under tension |
| Thick places | Visible bumps, uneven dye uptake (darker spots) | Visible from 30cm |
| Neps | Small knots on fabric surface | Visible on close inspection |
7. Testing Procedure
- Sample conditioning: Yarn conditioned at 20±2°C, 65±4% RH for 24 hours
- Test setup: Yarn placed on Uster evenness tester with appropriate test speed (400 m/min typical)
- Test duration: 2.5 minutes per test (1000m of yarn tested)
- Sensitivity settings: Thin places at -50%, thick places at +50%, neps at +200%
- Reporting: Uster report shows CVm, thin/thick/nep counts, spectrogram, and percentile ranking
8. Reading an Uster Report
A complete Uster test report includes:
- CVm value: Overall evenness percentage
- Thin places (-50%): Count per 1000m — lower is better
- Thick places (+50%): Count per 1000m — lower is better
- Neps (+200%): Count per 1000m — lower is better
- Spectrogram: Shows periodic variations (machine-related defects)
- Uster percentile: How this yarn compares globally
9. Buyer's Checklist: What to Ask Your Supplier
- ✓ Can you provide Uster test reports for the yarn used in this order?
- ✓ What Uster percentile does your yarn meet (e.g., 25% or better)?
- ✓ What are the CVm, thin place, thick place, and nep values?
- ✓ Do you perform Uster testing on every yarn lot?
- ✓ How do you handle yarn that fails Uster standards?
10. Yarn Evenness Requirements by Product Type
| Product Type | Minimum CVm | Maximum Thin Places | Maximum Neps |
|---|---|---|---|
| Solid color basic scarf | ≤16% | ≤20 | ≤150 |
| Striped/multi-color scarf | ≤14% | ≤15 | ≤120 |
| Premium cashmere scarf | ≤12% | ≤10 | ≤80 |
| Basic beanie | ≤15% | ≤20 | ≤150 |
11. Related Guides from Weave Essence
This guide is part of the Quality Guide (L1) series. It provides in-depth coverage of yarn evenness and Uster testing for knitted scarves and beanies (L2 depth).
Need help with yarn quality specifications for your order? Contact our team →